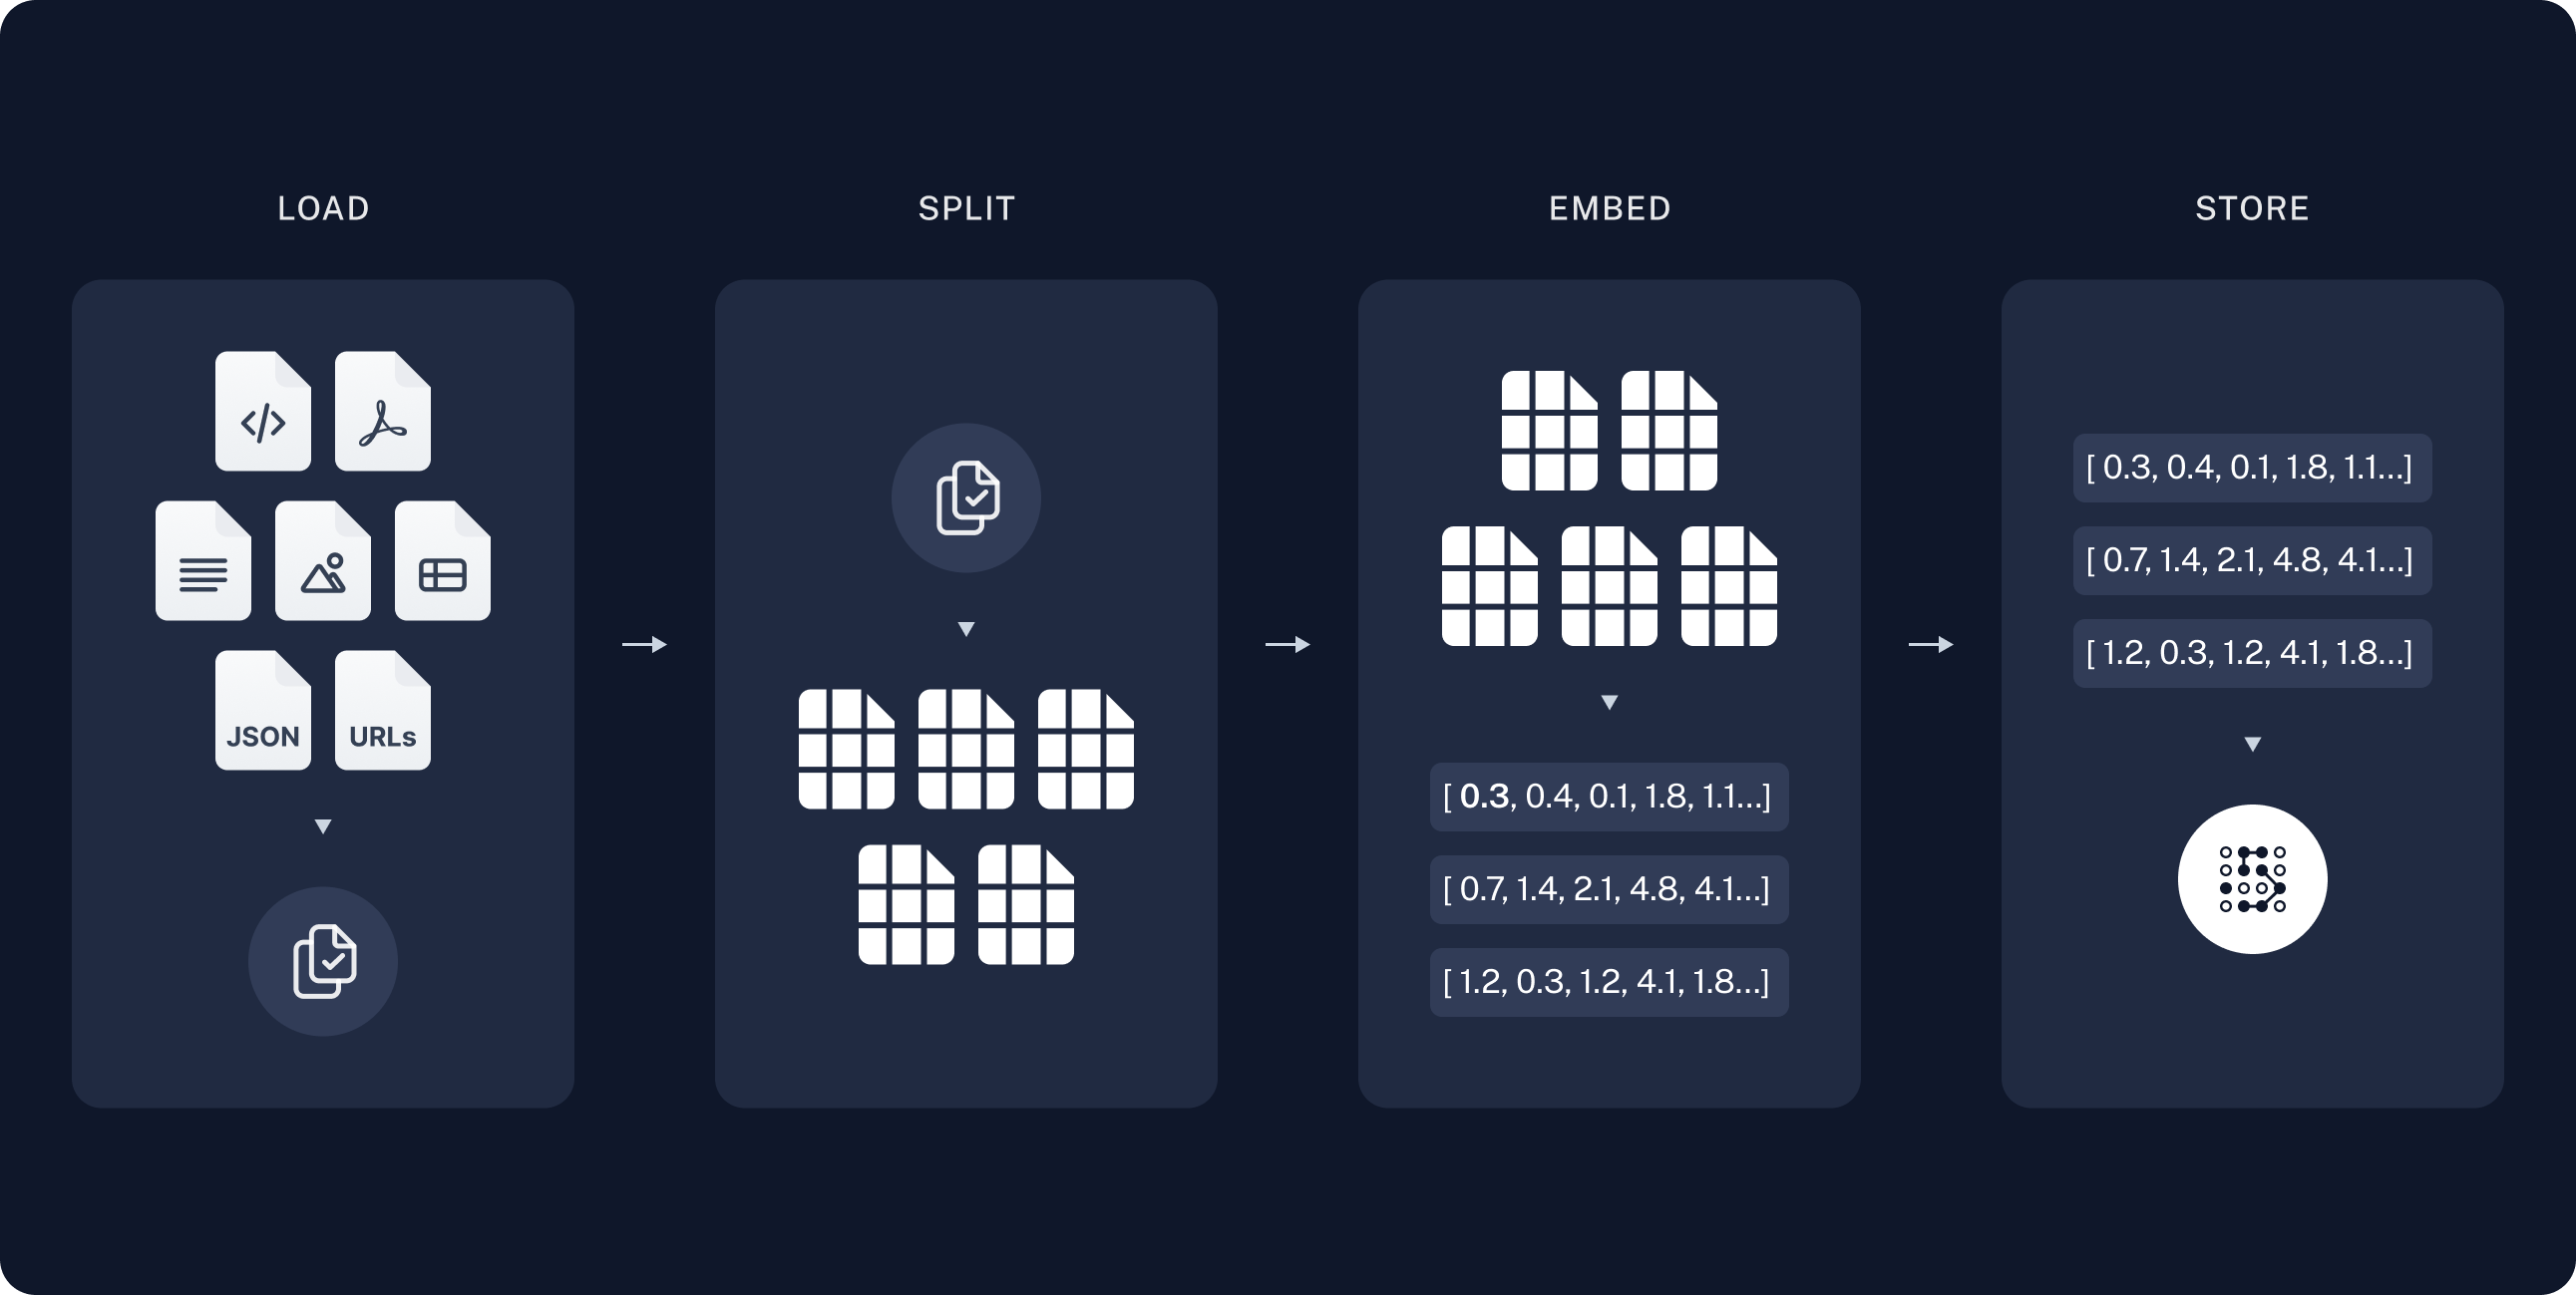
A Retrieval-Augmented Generation (RAG) model is a powerful process that combines a large language model with your own data. This could be anything from chat conversations, database tables, PDF documents, and more.
In my experience, many organisations are keen to use the power of AI to streamline operations and improve efficiency. However, there’s often a hesitation about sending sensitive information to external companies for storage or training purposes.
This is where local RAG models come into play. By keeping everything in-house, you can maintain control over your critical business data, which is often tucked away in offline documents like PDFs.
Setting up a local RAG pipeline for your business is worth considering — whether it’s running on a laptop for individual use or on a local server with a few GPUs.
If you’re keen on exploring the code, it’s all open-source and available on my GitHub. Feel free to check it out and give it a star if you find it useful!
As AI becomes more integrated into our daily lives, the importance of data privacy and security has never been more crucial. With growing concerns about where personal information is going — especially with online giants like Meta or OpenAI — it’s time to explore the benefits of using offline AI models with Ollama.
Why Offline Models?
Offline models operate independently from cloud servers, ensuring that sensitive user data never leaves your device. Key benefits:
Faster Response Times — no waiting for internet connectivity or server response times
Enhanced Security — your personal data stays on your device, reducing the risk of unauthorised access
Full Control Over Data Usage — you maintain complete control over how and when your data is used
Why Open-Source Platforms Like Ollama Matter
Data Sovereignty — your personal information belongs to you, not a third-party server
Reduced Dependency on Online Services — continue using AI tools even without an internet connection
Increased Trust — users engage more with AI applications that prioritise data security
Minimum Requirements for Running Local Models
RAM: Minimum 16GB (64GB+ recommended for larger models)
CPU: Modern multi-core processor
Storage: At least 50GB of available space
GPU (Optional): For enhanced performance with larger models
The installation differences between Linux, Mac, and Windows are minimal. You can also take this further and deploy a server that only you and your company have access to.
Learn how to develop a tailored propensity model using GA4 data to predict user behavior and conversion likelihood for any key event in your analytics setup.
Introduction
While GA4’s built-in predictive capabilities focus primarily on purchase and churn predictions, many organisations need to forecast different types of conversions. This guide demonstrates how to construct a custom propensity model in BigQuery using your GA4 data, allowing you to predict any conversion event that matters to your business.
What You’ll Need
GA4 property configured and collecting data
BigQuery project set up and linked to GA4
Defined key conversion event(s) in your analytics
Familiarity with your GA4 event structure
Step-by-Step Implementation
1. Create Label Table
First, we’ll identify users who have completed our target conversion action:
SELECT
user_pseudo_id,
MAX(CASEWHEN event_name ='target_conversion_event'THEN1ELSE0END) AS conversion_flag
FROM
`your-project.analytics_XXXXX.events_*`
WHERE
_TABLE_SUFFIX BETWEEN'DATE-START'
AND'DATE-END'
GROUP BY
user_pseudo_id
This query creates a binary flag for each user, marking whether they’ve completed the conversion event (1) or not (0).
2. Create Demographics Table
WITH first_values AS (
SELECT
user_pseudo_id,
geo.cityas city,
device.operating_systemas operating_system,
device.browseras browser,
ROW_NUMBER() OVER (PARTITIONBY user_pseudo_id ORDER BY event_timestamp DESC) AS row_num
FROM`your-project.analytics_XXXXX.events_*`
WHERE event_name ="user_engagement"
AND _TABLE_SUFFIX BETWEEN'DATE-START'
AND'DATE-END'
)
SELECT*EXCEPT (row_num)
FROM first_values
WHERE row_num =1
3. Create Behavioral Features Table
SELECT
user_pseudo_id,
SUM(IF(event_name ='event_type_1', 1, 0)) AS cnt_event_1,
SUM(IF(event_name ='event_type_2', 1, 0)) AS cnt_event_2,
SUM(IF(event_name ='event_type_3', 1, 0)) AS cnt_event_3
Logistic regression is well-suited for propensity modeling — it provides interpretable results, handles numerical and categorical variables, outputs probabilities between 0 and 1, and is less prone to overfitting than more complex models.
CREATEORREPLACE MODEL `your-project.your_dataset.propensity_model`